

Enhancements that Enhance Profits… for Everyone!
Behind the scenes, the Quoter team has been working on improving our Reporting capabilities, and we’re ready to share our work with our Quoter Partners.
If you’re not familiar, Quoter’s Reporting is included in our Pro and Enterprise plans, and has been available as an a la carte add-on for other users. We’ve tightened up the focus to look at the profitability of Won quotes, expanded the breadth to look at all items (not just ones in your Quoter catalogue), and reworked the analysis to split out recurring and one-time items.
The best part? We’re giving access to our new enhanced Reporting to all Quoter Partners until the end of 2025. Please try it out and let us know what you think!
- Direct link to get started if you’re signed in
- It never hurts to read the manual, especially when you’re trying something new.
- Here’s the KB article for Reporting. This is very useful if you’re moving over from our legacy reporting, as you can see how to toggle to/from the legacy view to the new views.
- You didn’t think we’d leave you without a video, did you?
- The best way to check this out was live at our Product Studio session…
- But if you missed that, here’s the YT video where Ash does a walkthrough:
Read on to see what’s changed / what’s new.
Why (and How) We’ve Enhanced Reporting
Quoter has a much tighter focus on IT managed service providers (useful for other service-based business too!), and the enhancements that we’ve made to Reporting reflect a better way to report on profitability of both project / one-off items and recurring service items.
- Reporting is solely focused on profitability
- Legacy functionality had some reporting on different pipeline stages, but it didn’t really effectively give a full view of quotes in all stages.
- The new Quote List that we released earlier this year provides a much better view of quotes at various pipeline stages; you can filter and save views to see what’s out there and might be coming.
- We’ve refocused Reporting to look only at Won quotes, to see real deals that are generating real business revenue, and thus to give a closer look at real profits.
- Reporting has the profitability of items from all sources
- Legacy only had items in your Quoter catalogue, and had no visibility into other source items.
- We recognize that many MSPs have their service catalogue items in their PSA, and the new Reporting has these included.
- Reporting splits out recurring and one-time items
- Recurring services are the lifeblood of the MSP business, and our legacy reporting was not able to analyze these.
- You can now see both recurring and one-time items in a detailed analysis, with the ability to drill down right to the profitability at an individual quote level, or rolled up to examine at a high level by product Line Item or Salesperson.
What you get is a clearer, more accurate way to understand your business performance based on what you’re actually selling. You can now view profitability by product, line item, and salesperson, making it easier to see what’s working, what isn’t, and where to focus your efforts.
What’s New with Quoter Reporting
Reporting remains divided into two tabs, which we’ve called Leaderboard and Line Items (renamed from Items). Leaderboard looks at who is selling, and Line Items looks at what is selling. This gives you two different views that you can use for different purposes:
-
Leaderboard
The Leaderboard breaks down all of your Won deals by salesperson / account manager / user; we’ve titled it Won Quotes by User on the tab. It’s a clean, singular view of your whole team and how much they’ve sold. Most importantly, it lets you compare the performance of all account managers and sales users to identify top performers and areas for improvement.
Have a look at Leaderboard, and mouse over.
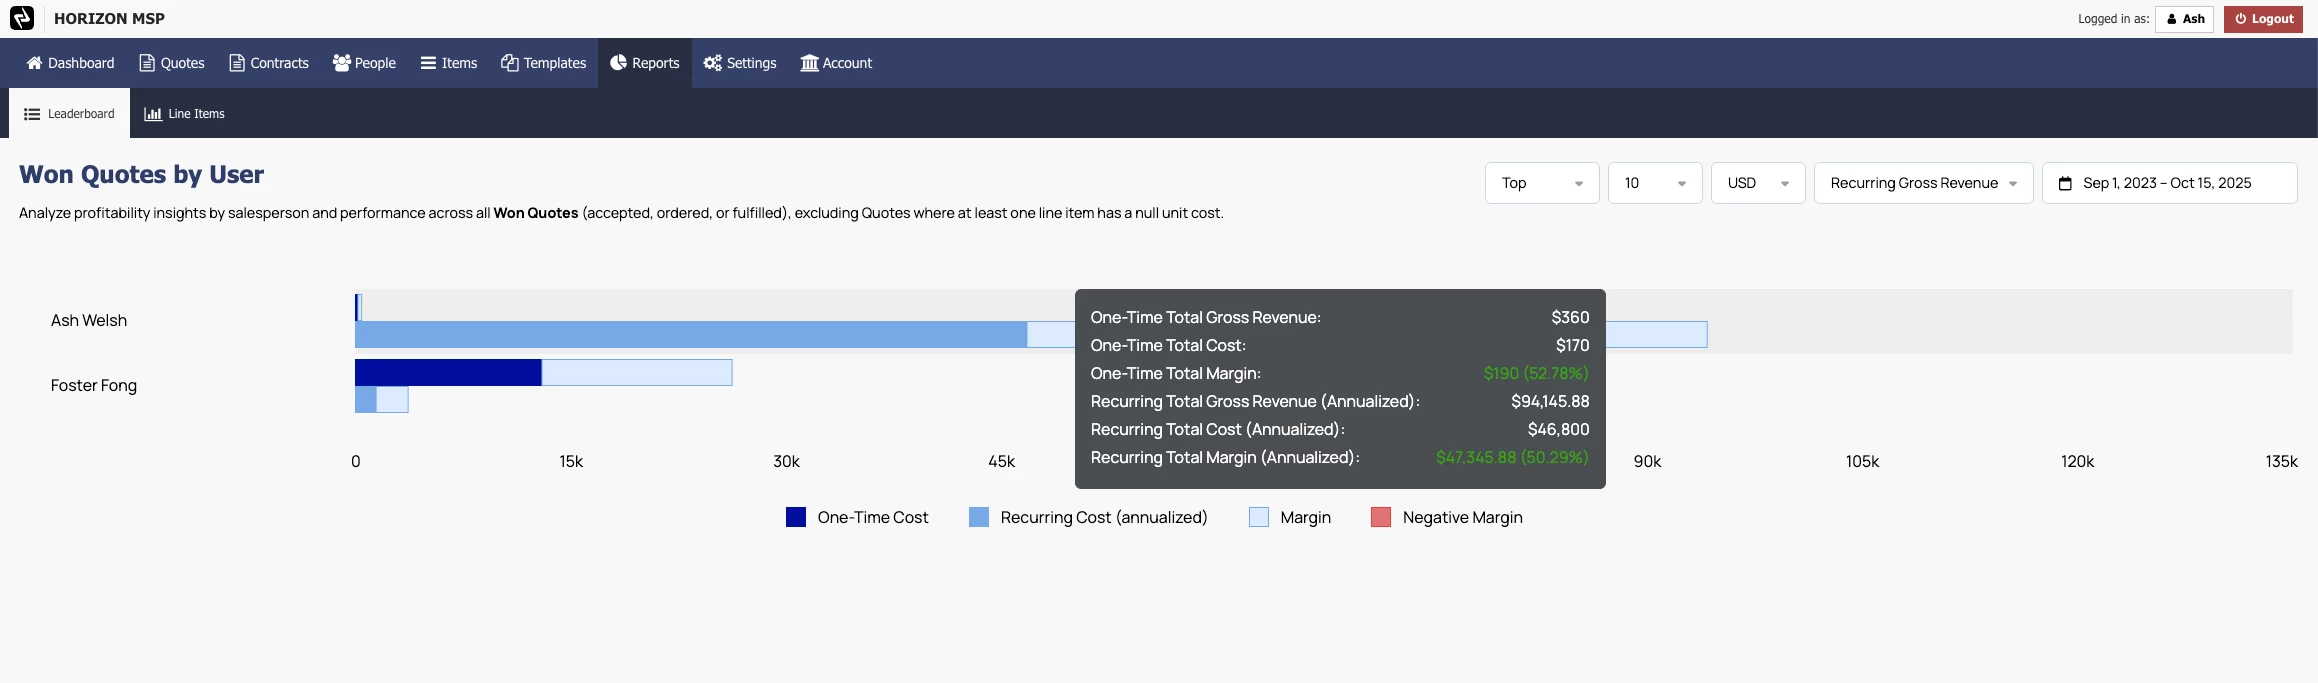
You’ll see Won sales on the bar chart split into (annualized) recurring and one-time items, with
- Total Gross Revenue
- Total Cost
- Total Margin
The purpose here is to let your team see at a glance if there are any issues, and compare performance against your margin expectations or guidance.
-
Line Items
Line Item Profitability Reporting: Drill down into every line item (on Won quotes on your selected time period), including recurring and one-time sales. We give you different ways to view this by using the dropdowns on the top-right:
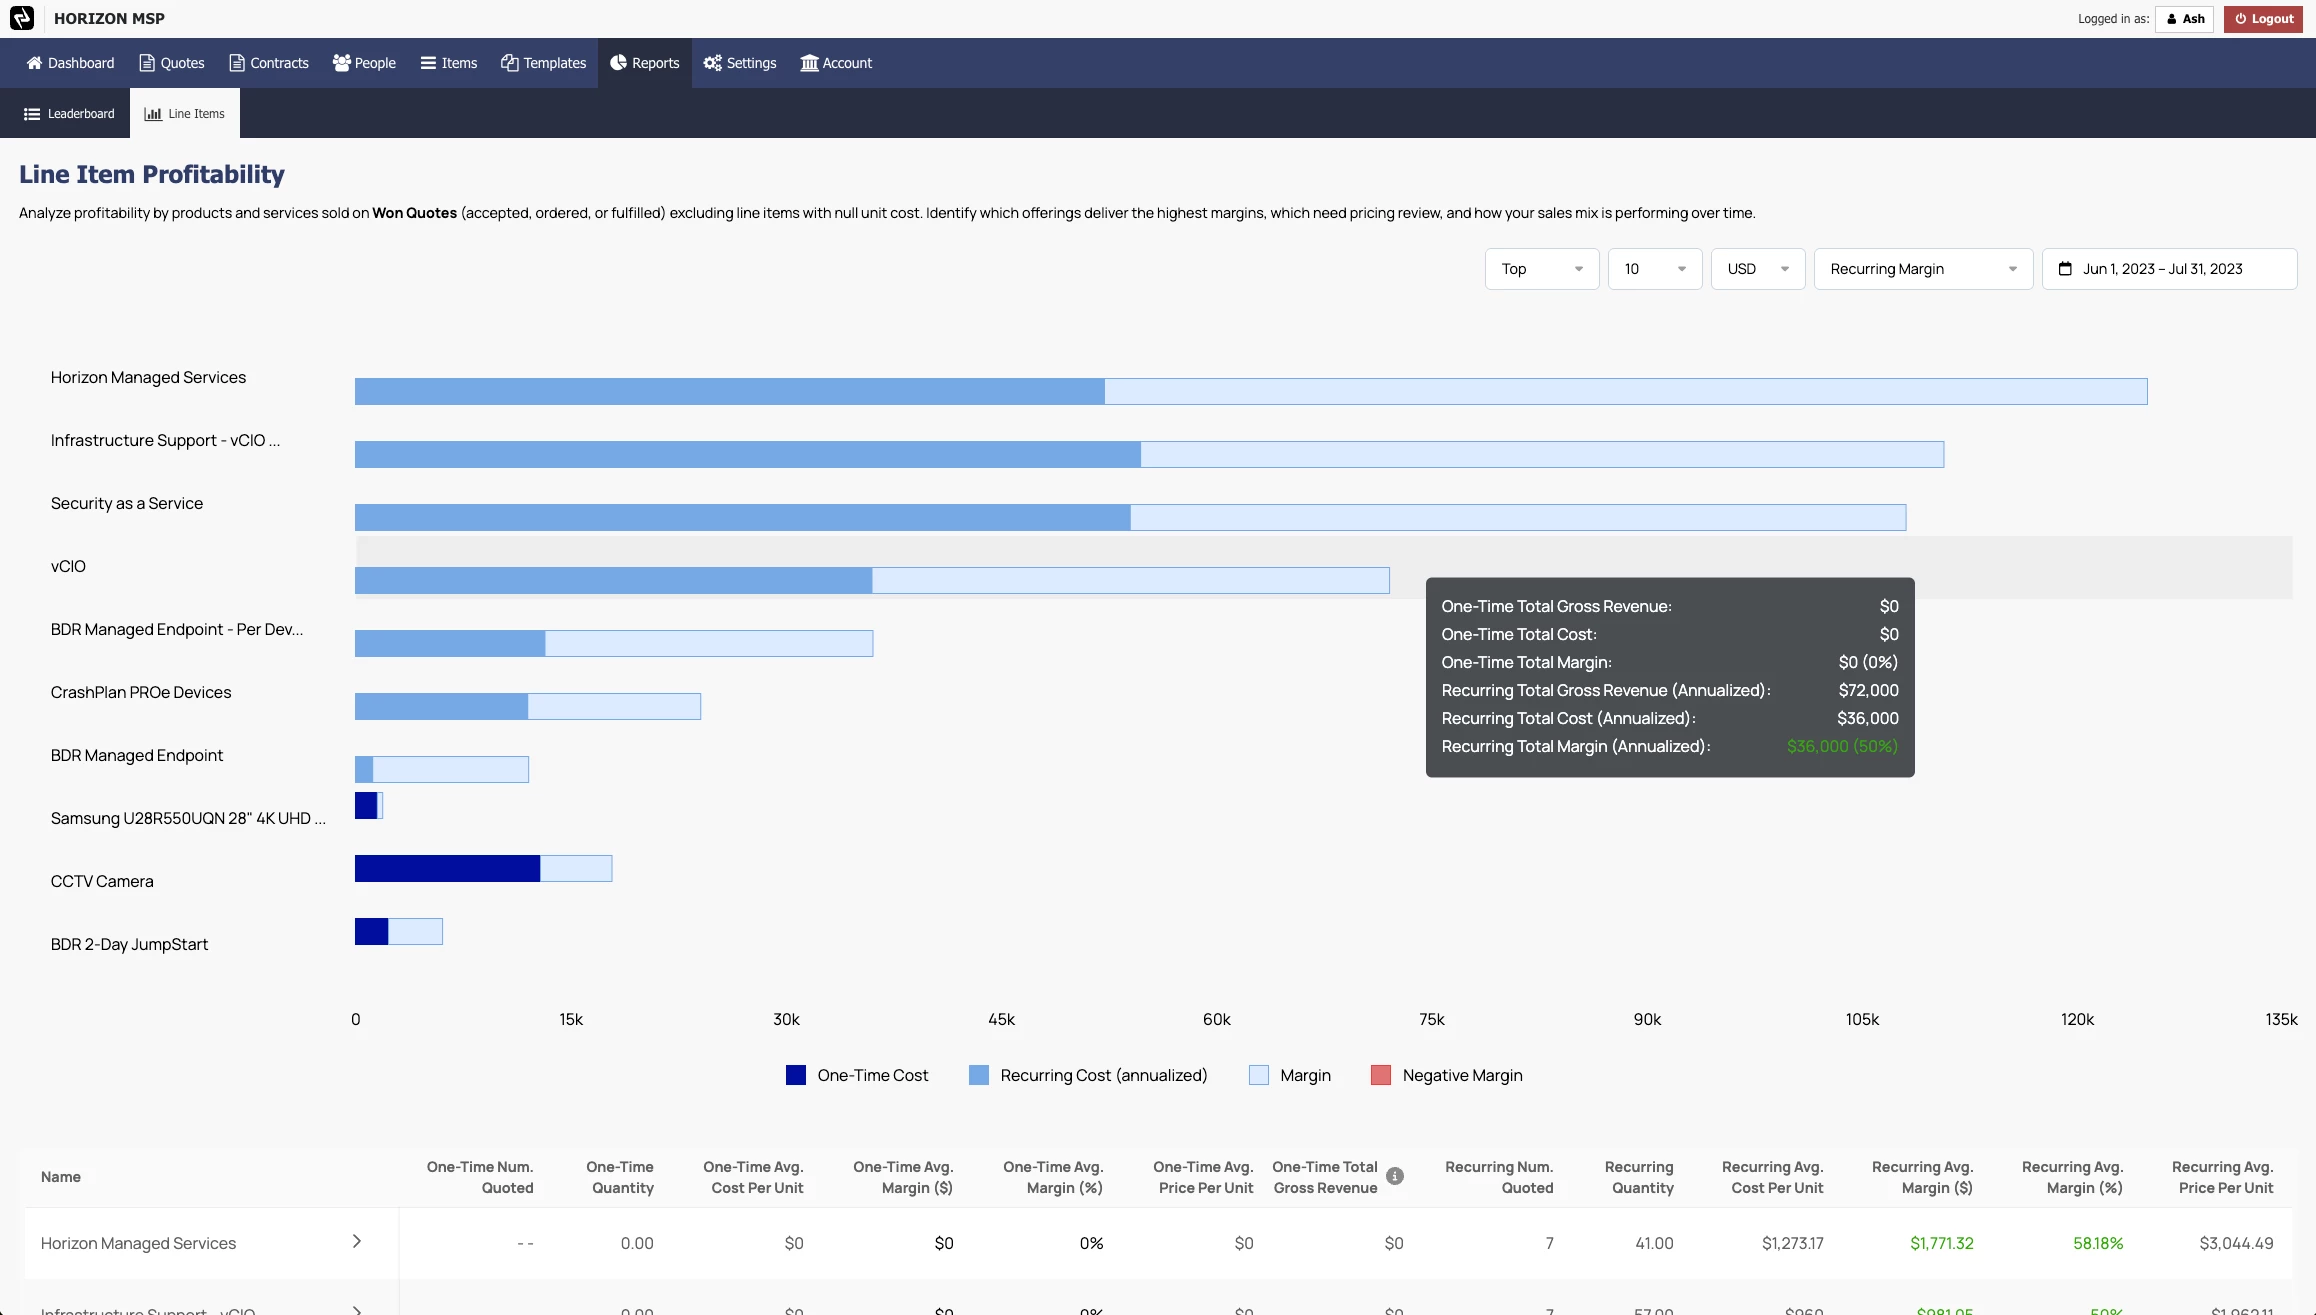
- First, you can select whether you want to look at your Top or Bottom items, and then break these down into cohorts of 10 items to chart. Top are the highest total margin items; Bottom are the lowest total margin items.
- Second, you can look at this in different currencies. Might not be important to you at all, but if you’re selling in multiple countries that use different currencies, this might be critical to make fair comparisons for international sales.
- Third, you can see your Top or Bottom items based on four different revenue or margin options, depending on whether you want to limit your analysis to recurring items like services or one-off sales for projects or hardware:
- Recurring Gross Revenue
- Recurring Margin
- One-Time Gross Revenue
- One-Time Margin
- Finally, you can look at different time periods. Set your own custom date range, or use our pre-selects for this month, last month, this quarter, or last quarter.
The Line Items are groups of similar products, intelligently grouped using manufacturer part numbers for cleaner, more accurate reporting. Ash calls this “semantic product grouping”.
You can see detailed analysis if you scroll down below the bar chart:
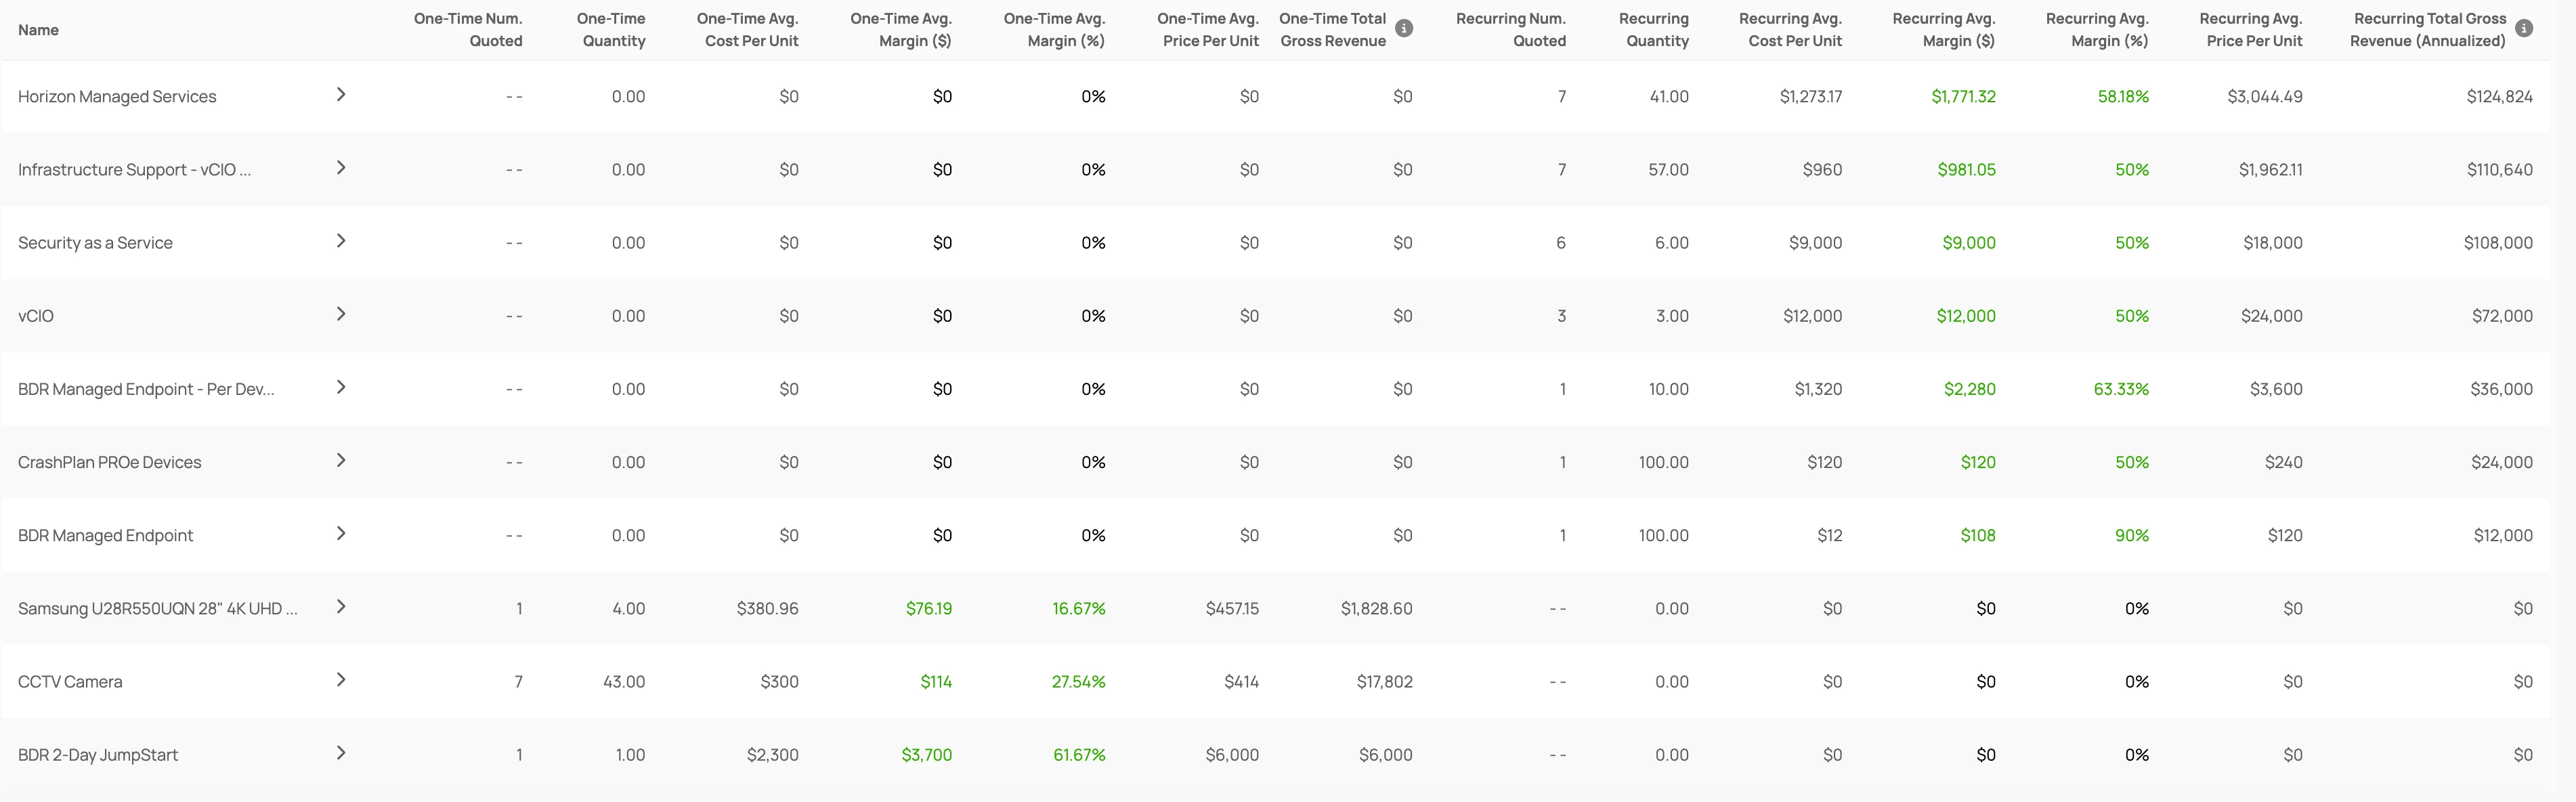
Note the details are split into one-time and recurring, with the number of quotes, quantity quoted, and calculated average margins. Note that we dynamically hide the recurring or one-time elements if they are empty, so you only see what you need to see.
And you can further drill down by clicking in to any item you’re interested in. Here’s an example; a CCTV camera:
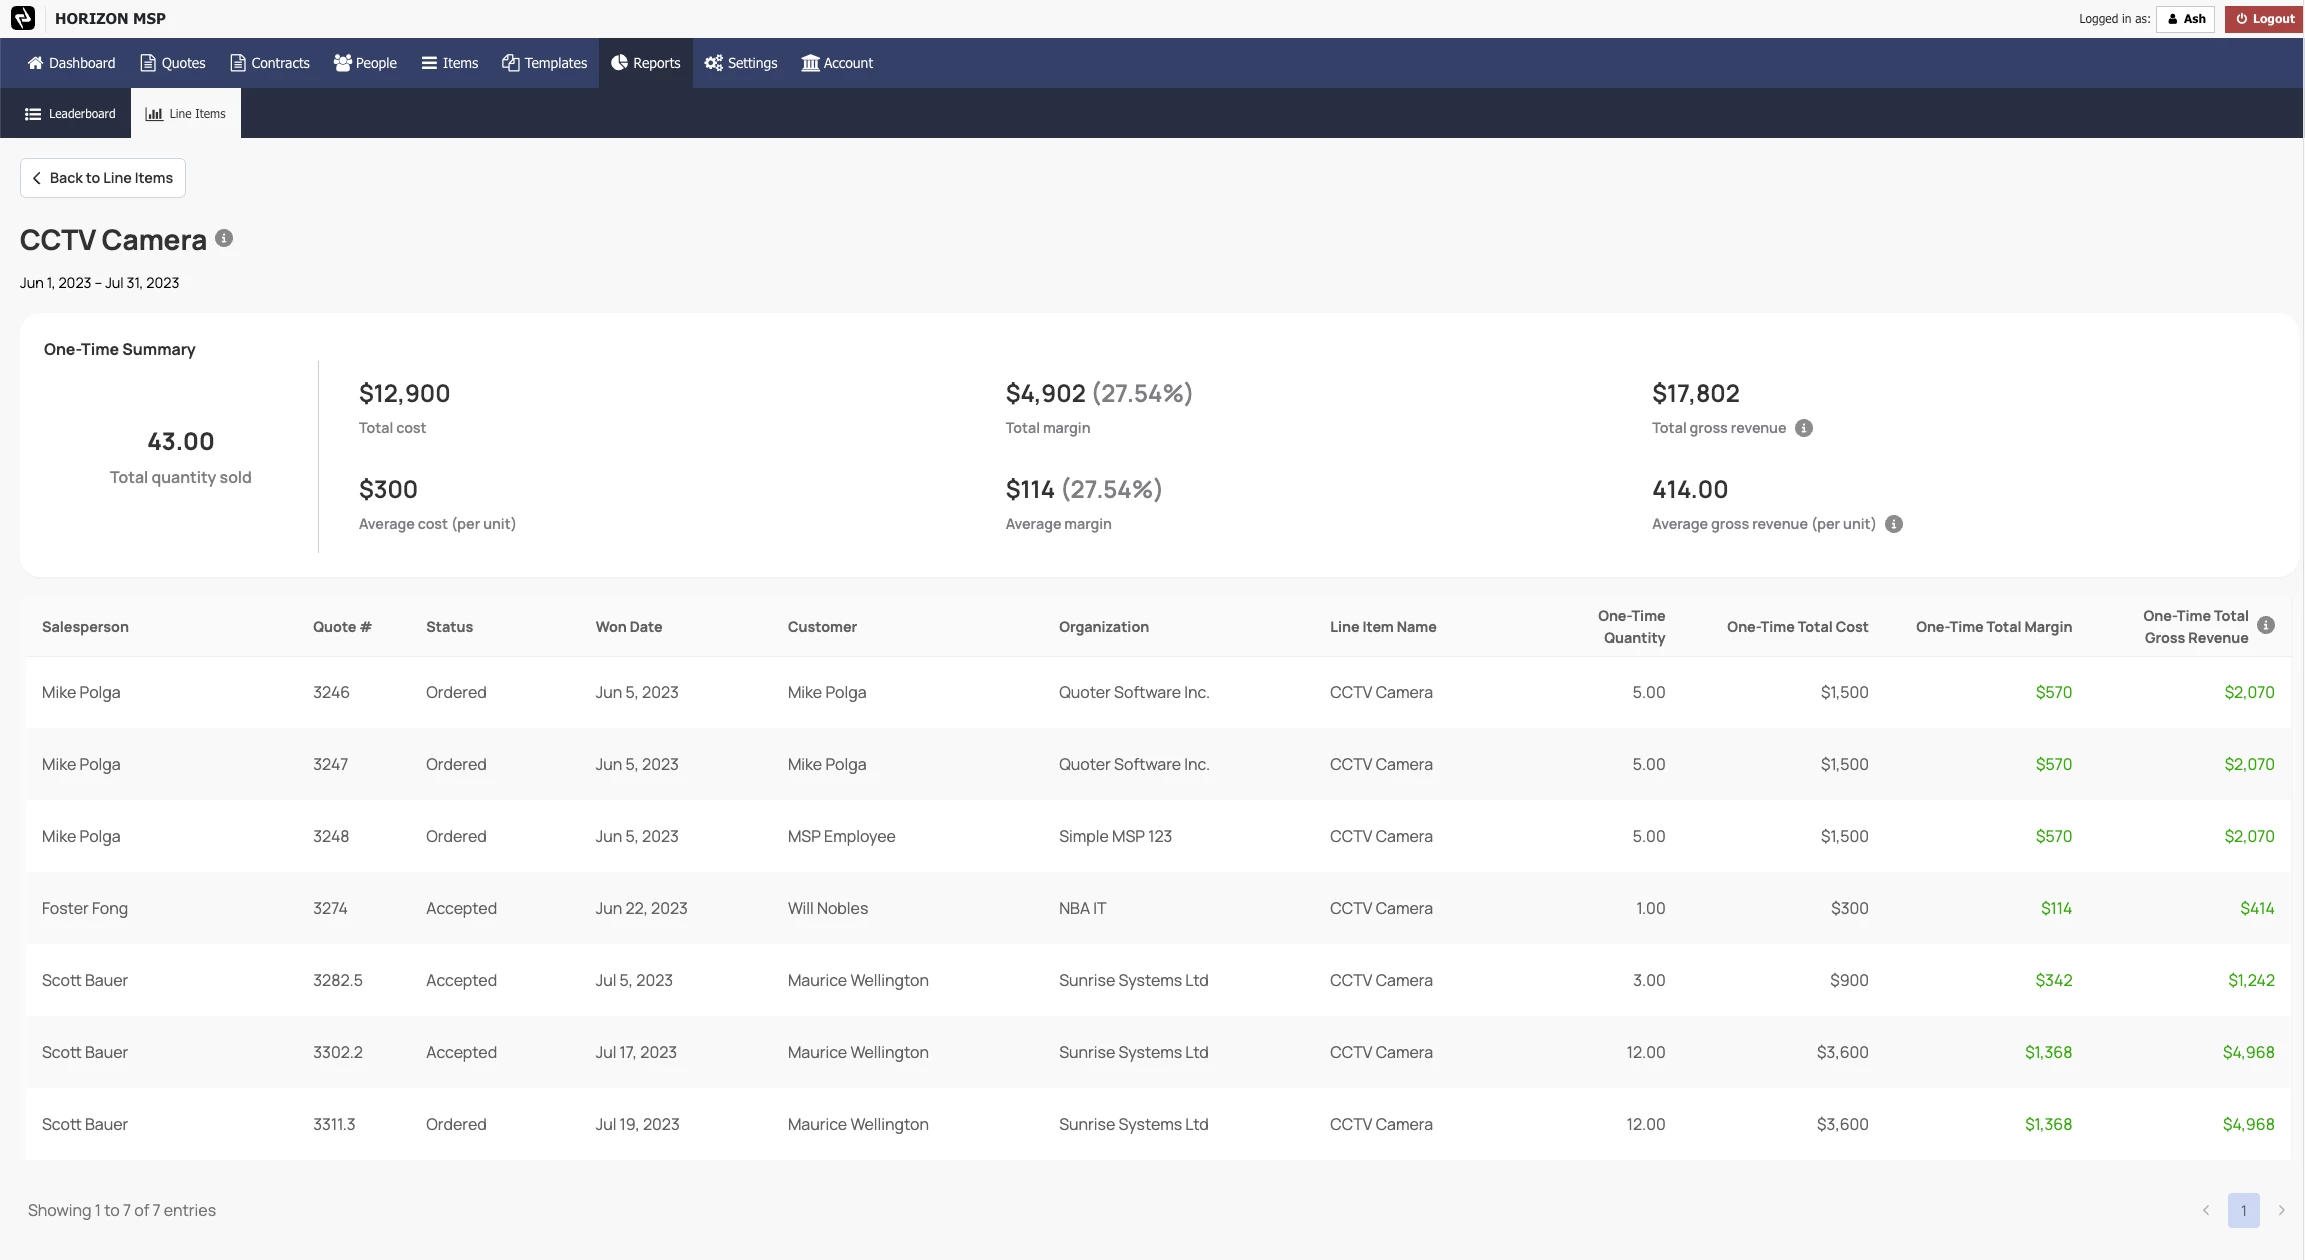
You can see which Salespeople are selling the CCTV camera item, how many they’re selling on each deal, and the revenue/cost/margin associated with each Won quote. You can also see every quote this item exists on.
Are there any important limitations to know?
Yes; there are two key limitations:
- We made a change to our data structure just over 3 years ago, so you can only go back to look at historical data up to October 3, 2022.
640K3 years of data ought to be enough for anybody, right? That quote would never haunt anyone.
Hope this limitation is not a concern for you, but it’s important to know that’s as far back in time as our data analysis permits.
- Profitability Reporting relies on including cost data. Without costs, all you have is top-line revenue, and you don’t know if you’re actually making any money. For our analysis to work consistently, we recommend that every item on a Won quote have a cost included, even if that cost is $0.
- Leaderboard requires that every line item on the quote have a unit cost.
- Line Item Profitability Reporting needs to have the unit cost included on that line item.
Important to note: $0 is OK, but null / blank / no value is NOT OK. If there is a quoted item with a null value included on a Won quote, that quote will be omitted from our Won quotes by profitability Reporting.
Report your Satisfaction
Quoter profitability Reporting isn’t a CFA-level detailed analysis, but it’s a near-instant, ideal way to give your team quick-and-painless oversight into where you are or are not earning profits on your best (or worst) products and services on deals that you’re winning. Patch up any profitability issues, and know your strengths.
Your report on Reporting is much appreciated, and will help guide our further development; please leave a comment below about what you think. If you’re not a Quoter partner yet, talk to your ScalePad account manager and get in on this!