
Seven for Cognition360
Not quite as many updates as we had in June, but our September update has new data / columns / pages / filters on several reports that add useful capabilities. Read on to get the details!
As always with our Cognition360 updates, we don’t push them, and only send them out on request. Please use this Jotform to ask for any or all of the reports here to be updated for you.
Which reports have seen updates?
Without further ado… there are seven updates across these five reports:
- Sales Dashboard (Sales workspace). There are four available updates to the Sales Dashboard alone.
- Opportunity Dashboard (Sales workspace)
- Ticket Audit Analysis Report (Service Delivery workspace)
- Configurations Report (Service Delivery workspace)
- Configuration Tickets Report (Service Delivery workspace)
You’re certainly using the Sales and Opportunity Dashboards (really should be if you’re not; they’re core reports for a reason…), and there are multiple updates on these Dashboards. Really, we’ve added some interesting capabilities across the board here, and feel we’re scoring a perfect 5/7.
Christy Strickland and I collectively decided it’d be better to dedicate a future session of our Cognition360 Learning Lab (linked here so you can register) so you can ask questions instead of dropping in a video. The session later this month (September 24, 2025) is going to be on Ticket Labor Analysis and Ticket Lifecycle, so this What’s New session will be happening October 22, 2025.
Did you miss our June update? Request those reports here, or check out the details on what was new.
What has been updated?
New Sales Projection page 📊
A new Sales Projection page has been added to both the Opportunity Dashboard and the Sales Dashboard.
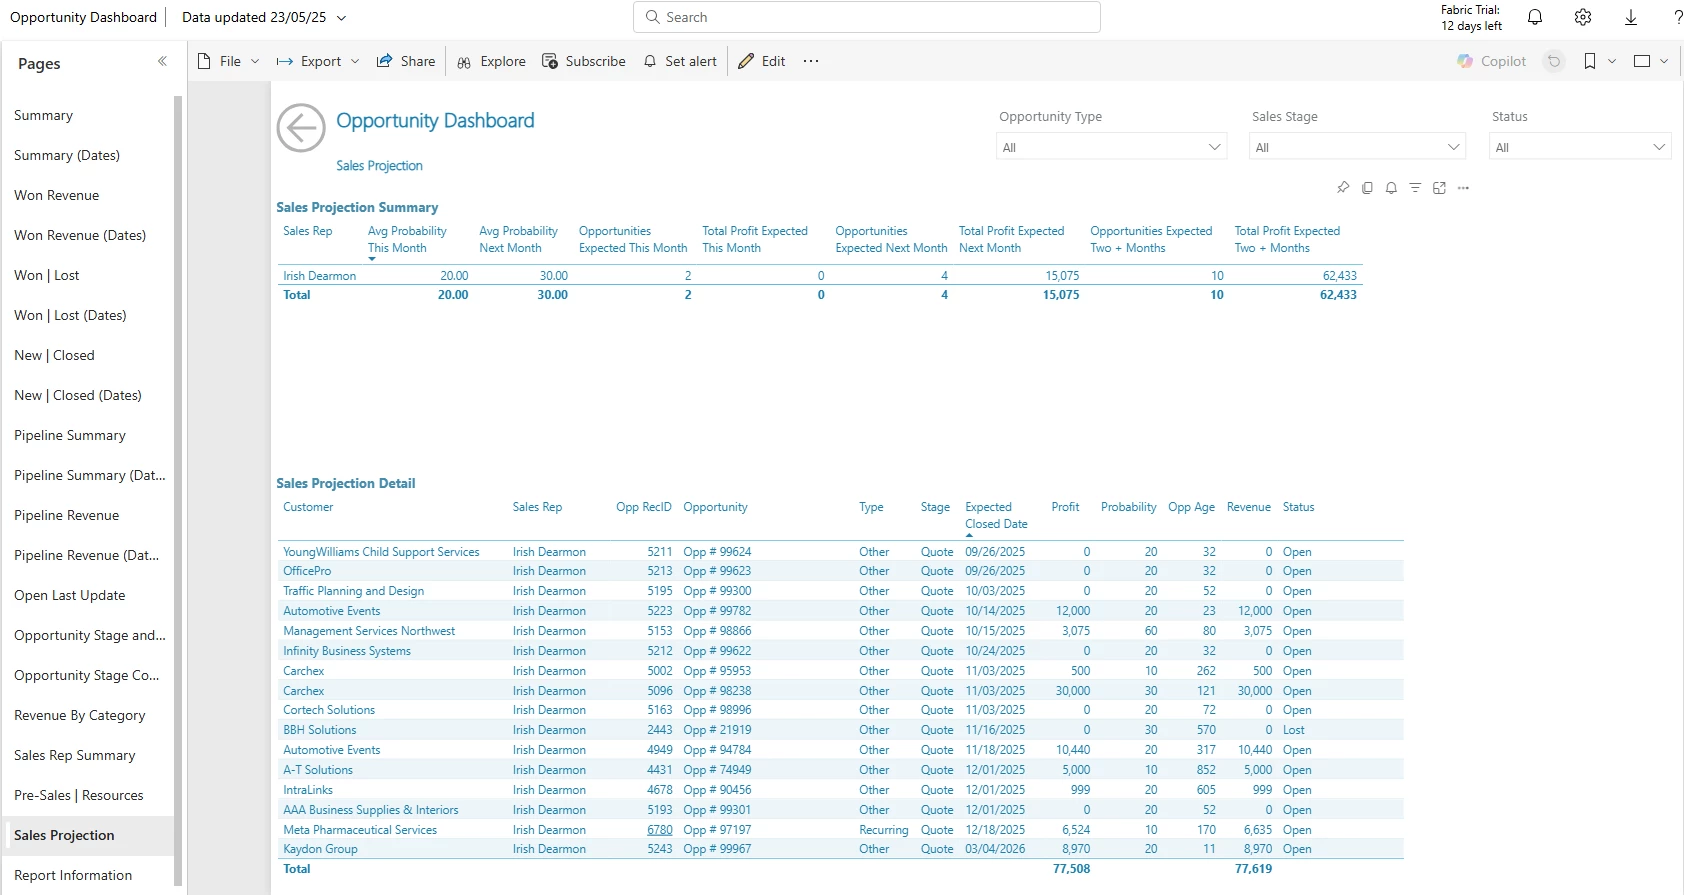
The new Sales Projection page shows the weighted projections for current month, next month, and next 2+ months by both Sales Rep and Customer, at both a summary and detail level.
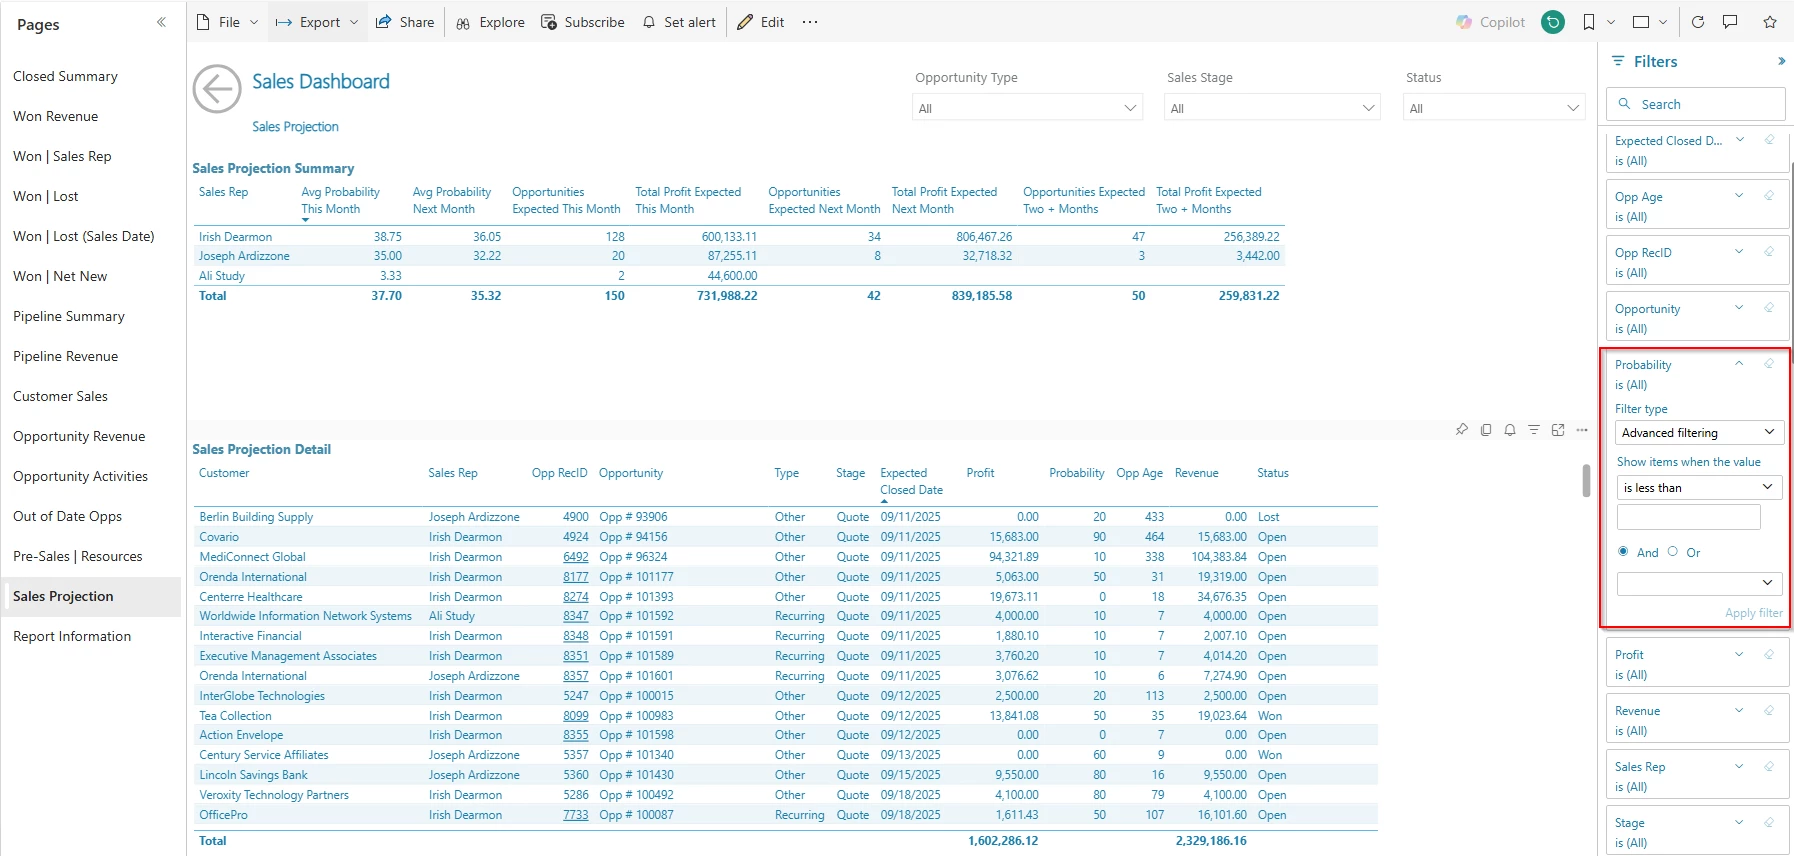
We think you’ll get the most value from the projections by using the probability filter. This allows you to include or exclude opportunities in your projections that meet a selected cut-off threshold. Most MSPs will only choose to include an opportunity in their projection if it has >70% probability of closing. Our example above would only have three opportunities that would meet this threshold, so the filter gives you a much better projection on expected business.
New filters for Company Team information 🧑🤝🧑
Company Team info has been added as filters to the Sales Dashboard:
- Company Team Role
- Company Team User
- Company Team Contact
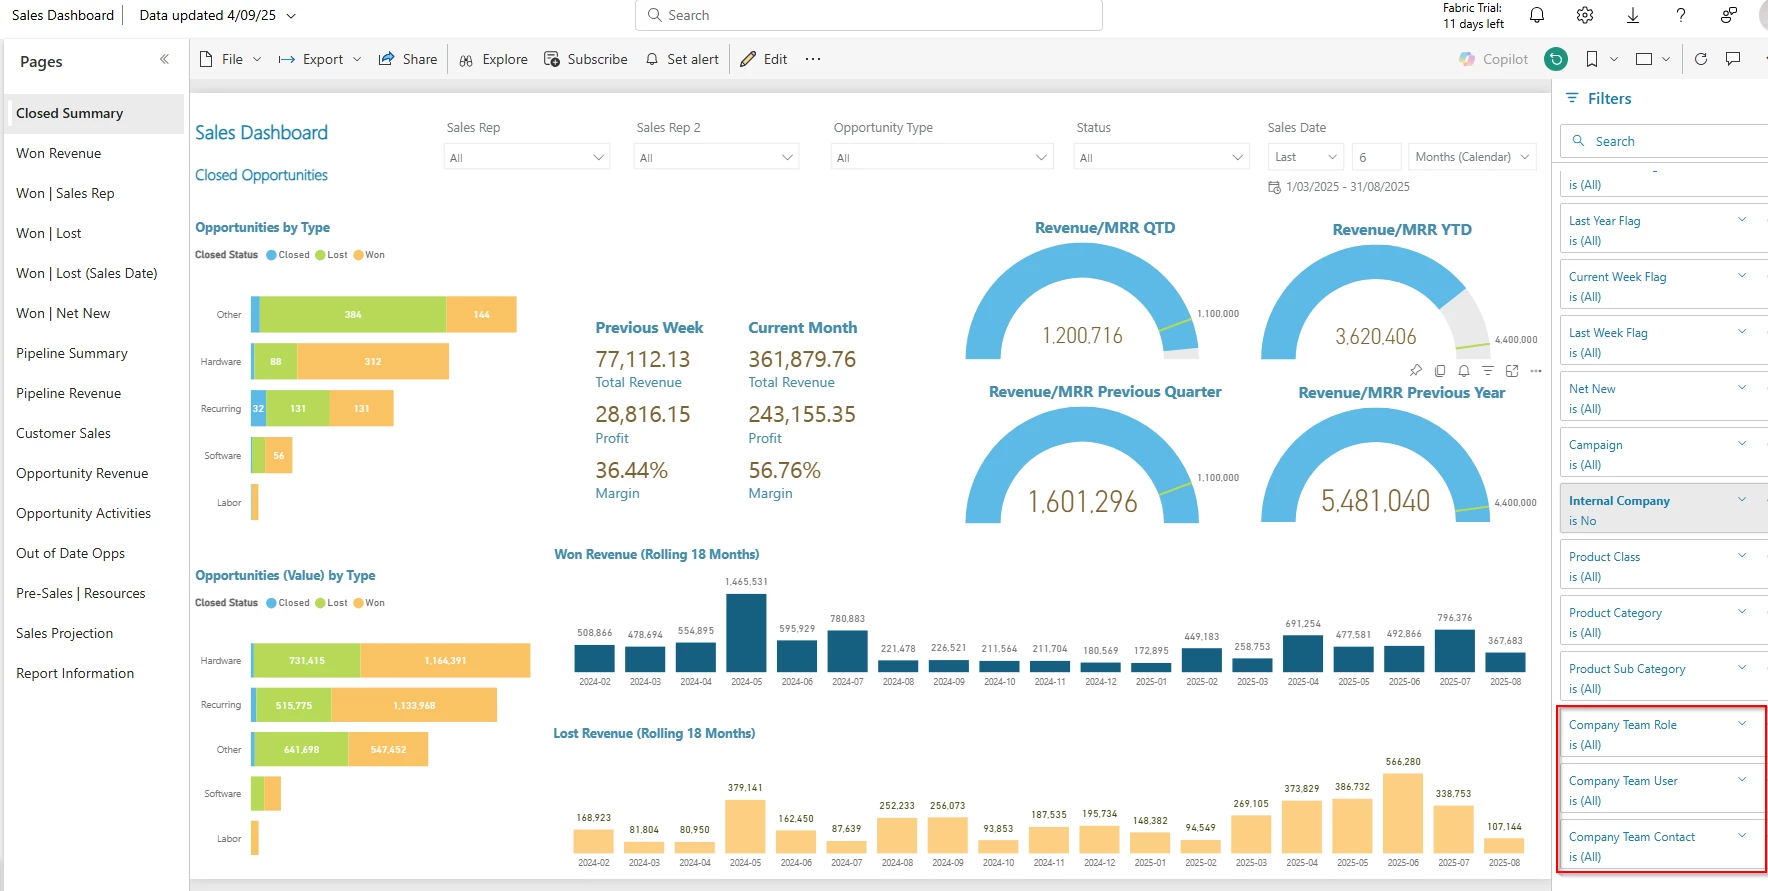
The purpose here is to be able to filter an opportunity by any member of the team. Suppose five new clients came on; which account manager / lead engineer should they be assigned to? If you have teams set up in CW, this should be useful for you. You can also use this filter to audit Company Team in just one screen, saving you a lot of time and effort versus doing this one-by-one in Manage.
You can also dig into the data in reverse, and examine all tickets that had no time, and get into why – is the team missing adding time entries that should be there?
Final important note: if you have renamed the Account Manager Role in Company Team to anything other than 'Account Manager', please reach out to our Support Team. We can then ensure it’s mapping properly.
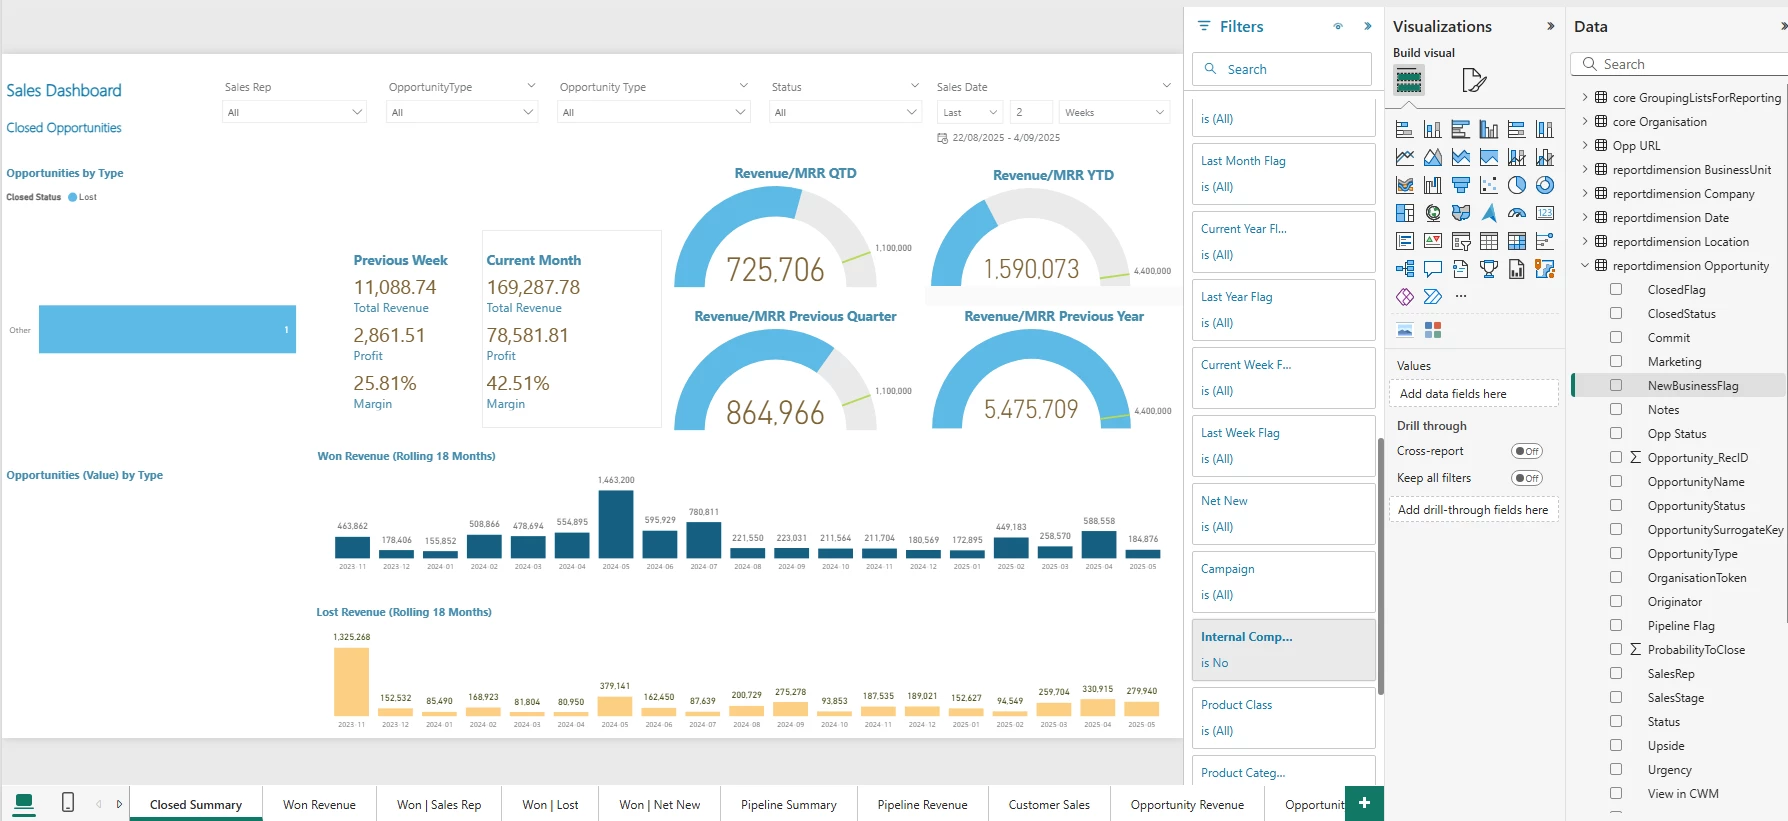
New filter for New Business Flag 🚩
New Business Flag has been added as a filter to the Sales Dashboard. The 'New Business Flag’ is calculated using days from when a company has been acquired (Company Acquired Date) to when it has become a lead in opportunities.
There are a few intricacies on using the New Business flag and getting it set up. First, there is a requirement of a days threshold business rule to be set up before the flag will work correctly. This is a business rule set up in the Cognition360 report database by our team, and there will be a little back-and-forth required communication wise on this – our Support team will need to know the threshold for us to set it up for you. If you choose to add the New Business Flag, you will need to contact our Support team directly.
That caveat aside, the Flag adds some useful filters. For example, you could look at every new client that came onboard last year / quarter / month / week and see what they’ve bought.
Won | Loss (Sales Date) 📆
We’ve added a new page called Won | Lost (Sales Date) to the Sales Dashboard:
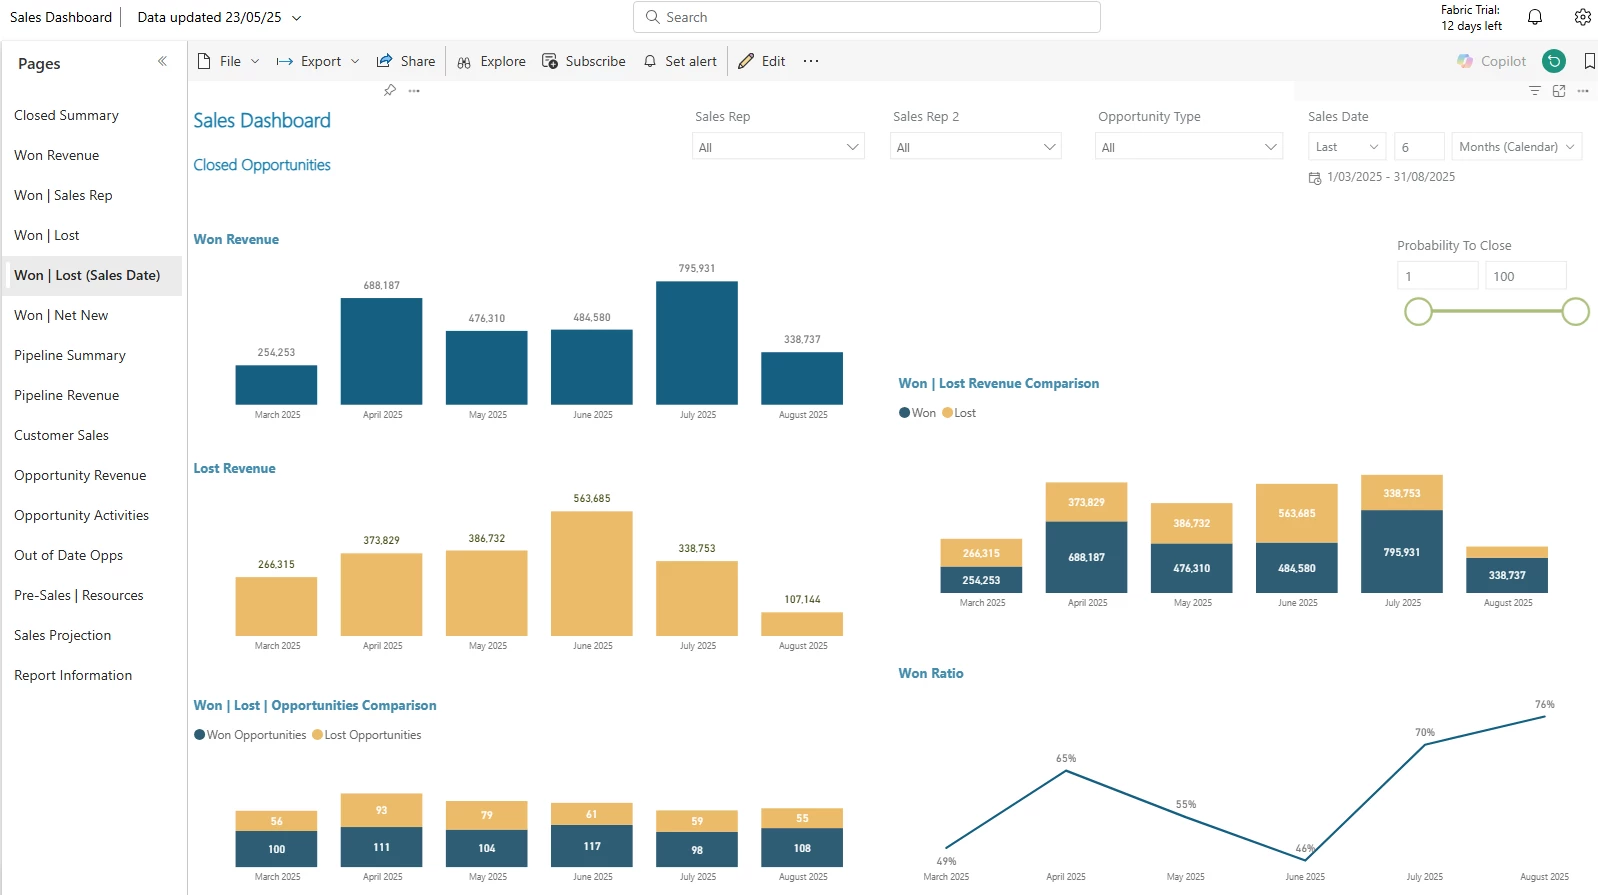
The new page shows Won and Lost Opportunity revenue and number of Opportunities within the closed date time period. There’s also a handy graph in the bottom left where you can see the ratio to compare won to lost opportunities charted by month in our example.
Board Movement for Ticket Audit Analysis 🎫
The Board Movement page of the Ticket Audit Analysis report has been enhanced for better analysis.
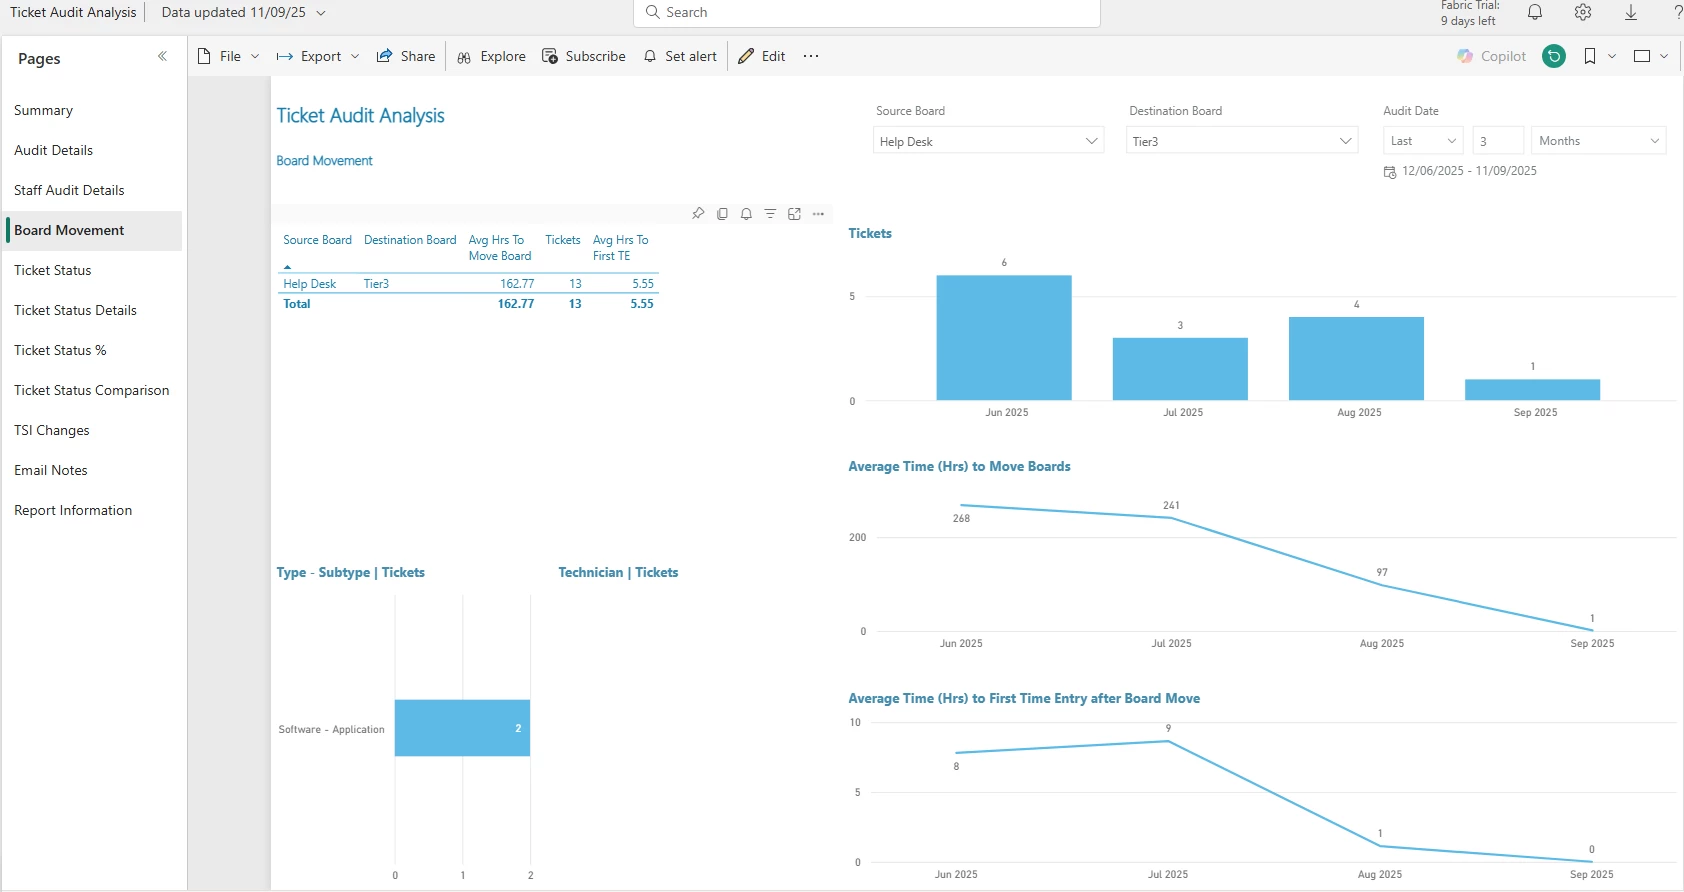
The report now includes the number of tickets and average time by month and week, by ticket type and subtype, and by technician when tickets are moved from a source board to a destination board. We’ve added “Avg Hrs To Move Board” and “Tickets”.
The granularity provides a lot more sort options, and you can now see the average time that each ticket sits on a board for. This is a great enhancement to your analysis of service delivery; for example, looking at moves from Help Desk to Escalation.
- How many escalation tickets did we move?
- How long did it take to escalate from the source Help Desk board?
- How long were we sitting on the Help Desk ticket?
If you use a ‘Triage’ board as a single intake point, this addition can assist as a useful efficiency measure to see how your dispatcher / service coordinator is doing in assigning out tickets.
Ticket Type (ActiveType) to Configuration Tickets Report 🎟️
The data model for the add-on Configuration Tickets Report has added a new dimension:
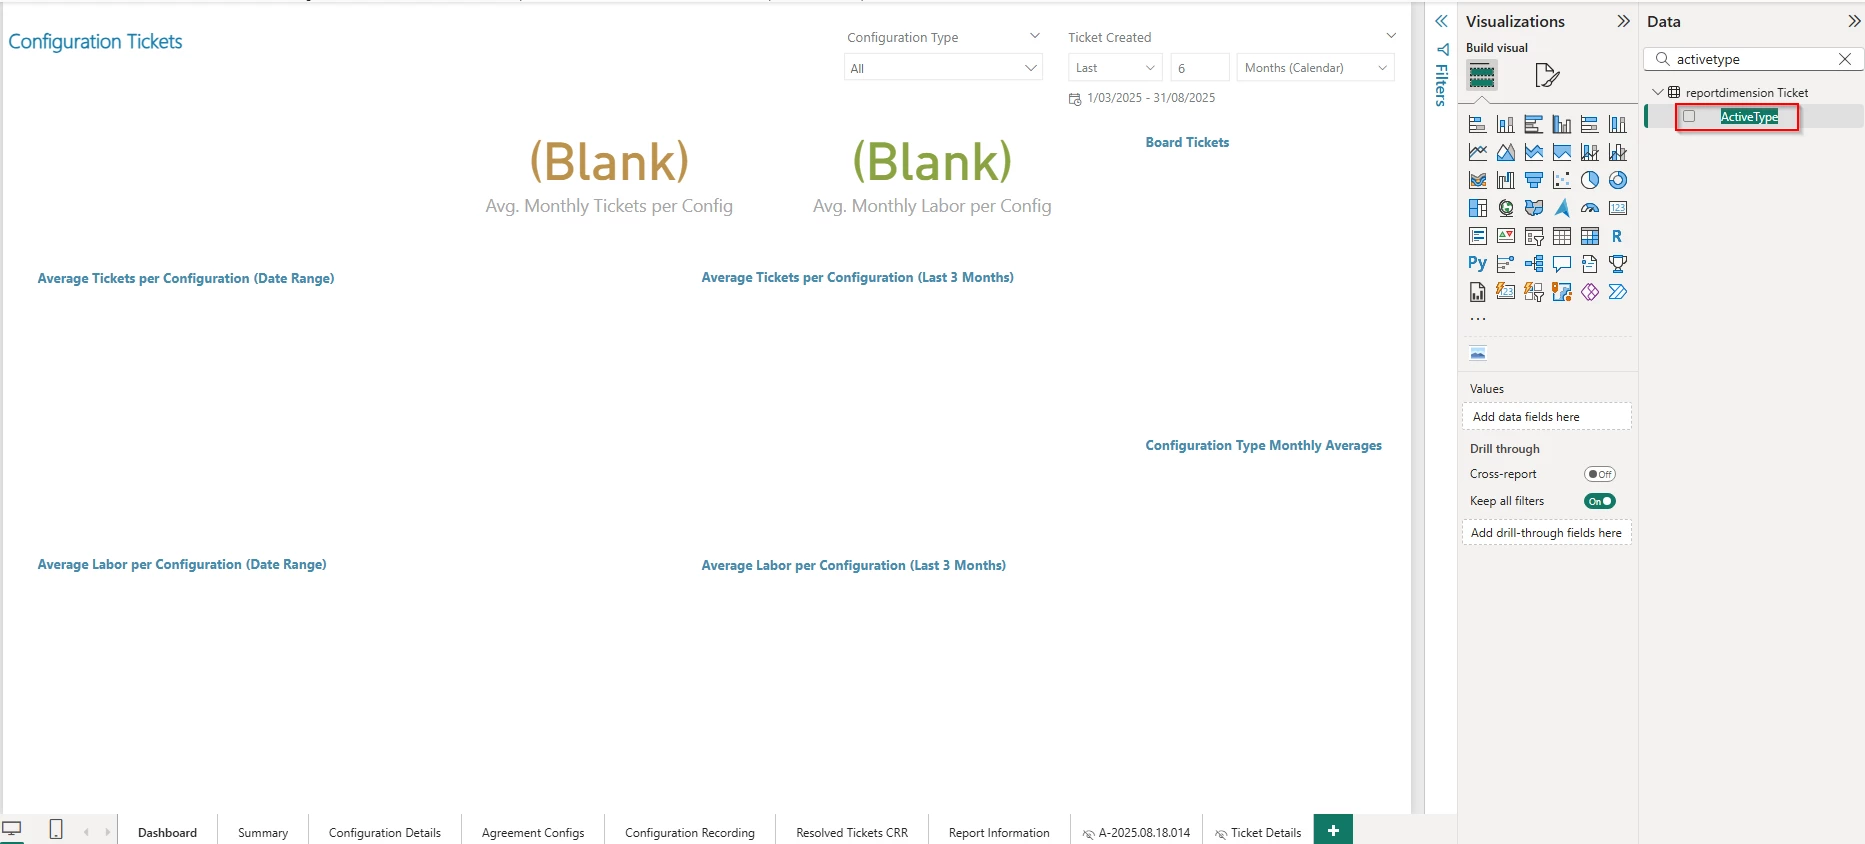
Visually, not a ton to see here as we don’t have configuration tickets populated in our demo environment, but this will allow users to identify the ticket configurations by Reactive or Proactive. Was this a maintenance ticket, or did the client call in about their configuration? Filter out all the Proactive Ticket Types and look at how your team is handling the Reactive Tickets, or vice versa.
Device Survey in Configurations Report 📋
We’ve updated the Device Survey in Configurations report:
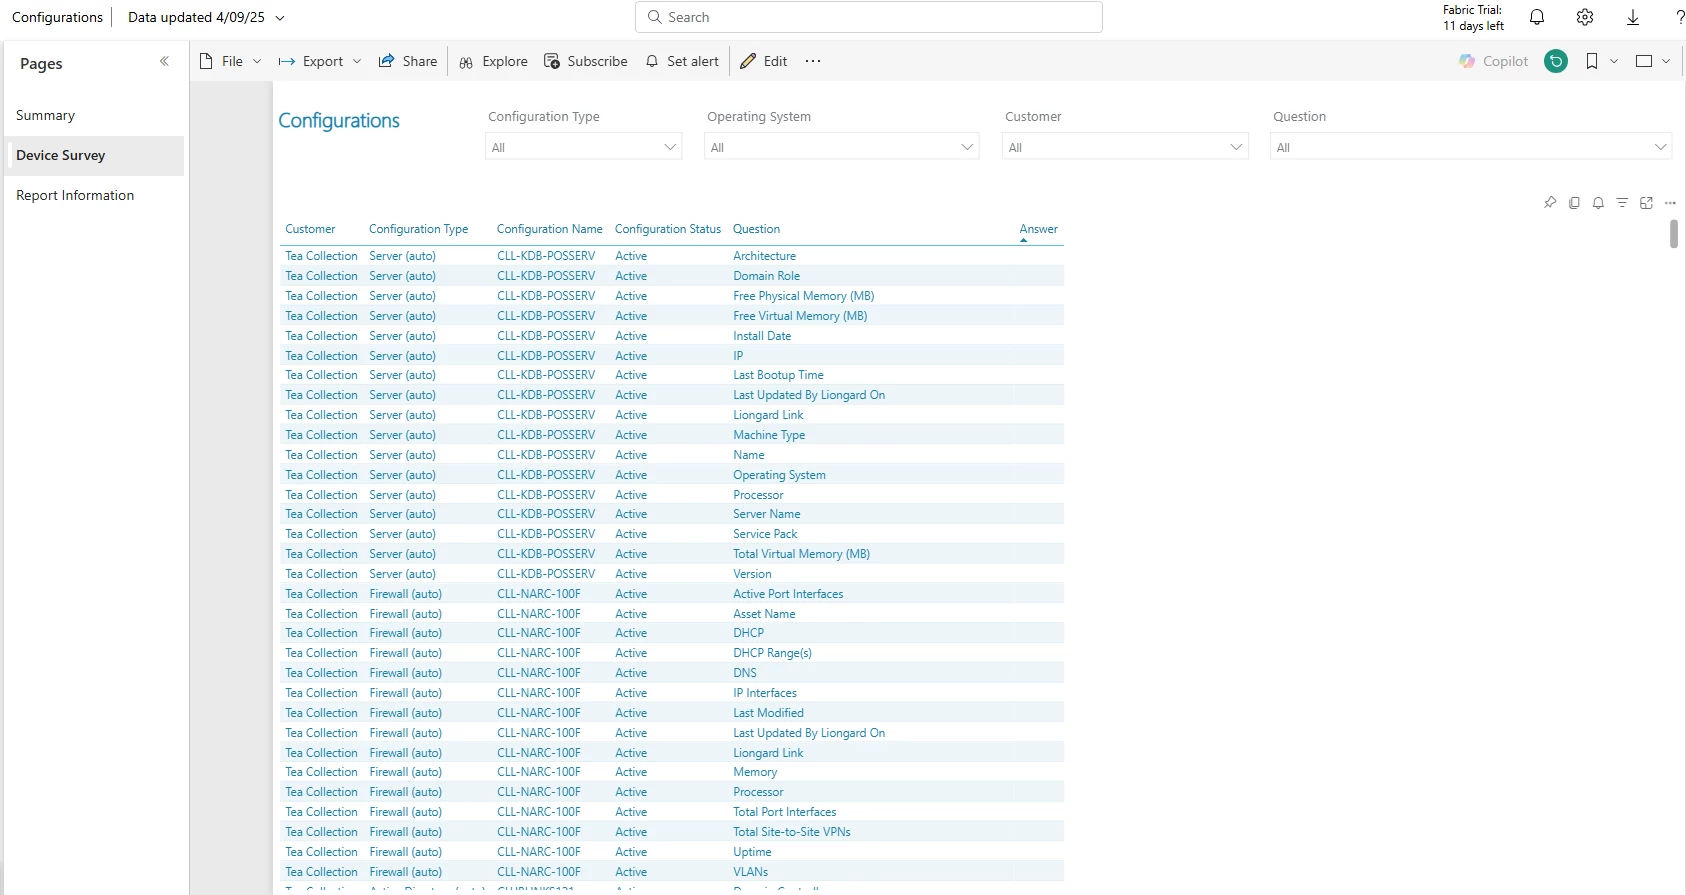
Questions and Answers from the Configuration Survey are now pulled in, making this report a whole lot more useful… as long as your linked documentation is up-to-date. See all the details on an individual machine’s configuration, right here in Cognition360.
If you’re not familiar with this report, it’s an add-on available on request, and not one of our standard reports. The Configurations report is designed to provide a view of configuration data assigned to tickets. See which configuration is generating the most tickets and labor. Have a complete look at our available reports here in our Help Center.
Power Up Your Reporting This September
We’re closing out the summer / previewing fall with these seven fresh enhancements to Cognition360 reporting for you, our partners. Please fill out this form and our support team can add the updated reports you want.
Already a Cognition360 partner? We’d love to hear from you here. Most of these upgrades were inspired by partner input, so your voice makes a real impact. Share your challenges and goals in a comment below; our team is here to help you overcome said challenges and reach those business goals.
Haven’t joined us yet? Sign up for a tailored demo or watch this overview to see how Cognition360 can reveal the story in your ConnectWise PSA data and help you build a more profitable MSP.